FORTRAN MP Application Development

Writing programs that run on multiple processors and take maximum advantage of the hardware is a difficult and complex task. Debugging and tuning these programs is even more difficult. The Silicon Graphics Software Development environment is one of the few toolsets specifically designed to facilitate the development of parallel programs.
There are three tools which, when combined, create a powerful development environment:
- POWER FORTRAN Analyzer - a program that automatically performs the initial parallelization of code.
- WorkShop Pro MPF - a visual interface to POWER FORTRAN that allows users to understand which parts of their program have been parallelized and why other parts can not be parallelized.
- WorkShop - a suite of tools that support the debugging of parallelized programs and performance analysis of each thread which the parallelized program executes.
Using WorkShop Pro MPF, programmers can develop their multiprocess applications on a
single processor system, use WorkShop Pro MPF to understand the code and produce a
multiprocessor version. Programmers can also execute the parallelized program on a
multiple processor system. The compiled executable will automatically determine the
number of processors available and execute accordingly.
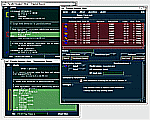
 Click to view a jpeg image (1.13 MB).

The POWER FORTRAN Analyzer is used for initial code parallelization. Users
run their code through PFA, which looks at the program structure, determines
which loops it can parallelize, which are best left serial, and which have
one or more obstacles preventing their parallelization.
PFA always errs conservatively - if it is not sure whether it can parallelize
a loop safely, it will not do so. PFA modifies the user original source to a
transformed source that is optimized and parallelized. It acts as a preprocessor
for the Silicon Graphics F77 compiler, which understands the parallel
directives and has its own MP extensions.

WorkShop Pro MPF provides a powerful visual interface into PFA transformations to show which loops were parallelized, which were not, and why they were not. In all cases where a loop could not be parallelized, WorkShop Pro MPF will show the user the obstacles to parallelization and allow the user to rearrange the algorithm to circumvent those obstacles. Where it can, WorkShop Pro MPF will prompt the user for the additional information that will allow PFA to parallelize that code section.
WorkShop Pro MPF also allows control over PFA assertions and directives, as well as parallelization and MP scheduling controls. Integration with the WorkShop Performance Analyzer allows the user to identify the most expensive loops in the program and concentrate on those, rather than waste effort tuning loops that do not use significant time during execution.
Understanding Parallelized Code
WorkShop Pro MPF provides the following capabilities that allow programmers to understand and develop parallelized code more easily:
- Lists all loops in the program with parallelization status
- Allows filtering by loop state: unparallelizable, parallel, serial, or those for which the user has requested modifications
- Allows filtering by source file or sub-routine
- Provides detailed information about each loop
- Displays source code, highlighting the selected loop
- Lists transformed loops coming from the original loop
- Shows correlated display of original and transformed sources
- Shows obstacles to parallelization and other messages
- Shows actual performance cost for the loop
- Displays a list of all subroutines and files in the program
- Highlights obstacles to parallelization
- Shows source lines of where obstacles are in code
- Shows relevant variable or subroutine names and their uses
- Works with the Workshop Performance Analyzer
- Allows sorting of loops by performance cost
- Annotates source display with performance information
- Allows straightforward composition of a custom DOACROSS directive
- Allows editing of parallelization condition
- Shows variables with read/write status within the loop, allows selection of state, and highlighting of uses of each variable within the loop

The WorkShop Programming Environment is specifically designed to handle the debugging and tuning of MP programs.
Multiprocess Debugger
The Multiprocess View of the debugger allows users to more easily debug parallelized programs. MP View allows users to set breakpoints at the creation of a new process, handle sprocs and threads. MP View also provides a separate debugging view for each thread of the program.
The performance analyzer has several views. All of the views can be used to look at performance of each thread of an executing program.
- Resource Usage View - helps identify CPU and 1/0 bottlenecks
- Function List - shows the performance cost of each function
- Callgraph View - displays function relationships during execution (e.g., who called whom and how often)
- I/O View - displays I/O activity on a file-descriptor basis
Sampling Paradigm
The performance analyzer utilizes a sampling paradigm that allows the collection of
performance data at specified points during program execution, and analysis of that
data during the different phases of the program execution. The sampling paradigm
is critical for very large programs as it allows for analysis of specific portions
of the program, and tuning of each portion individually.
Combined, these three tools provide a superb environment for facilitating the development
of applications to run on MP systems. Whether you are an experienced MP application
developer, or are trying to write your first MP program, the Silicon Graphics MP
development tools provide you with the functionality you need to take advantage
of all of the power of your systems.
![[Silicon Surf]](/view-sgi_n/http://www.sgi.com/images/home_icon.gif)


 Click to view a jpeg image (1.13 MB).


